music//01
Trend Predictions:
Music
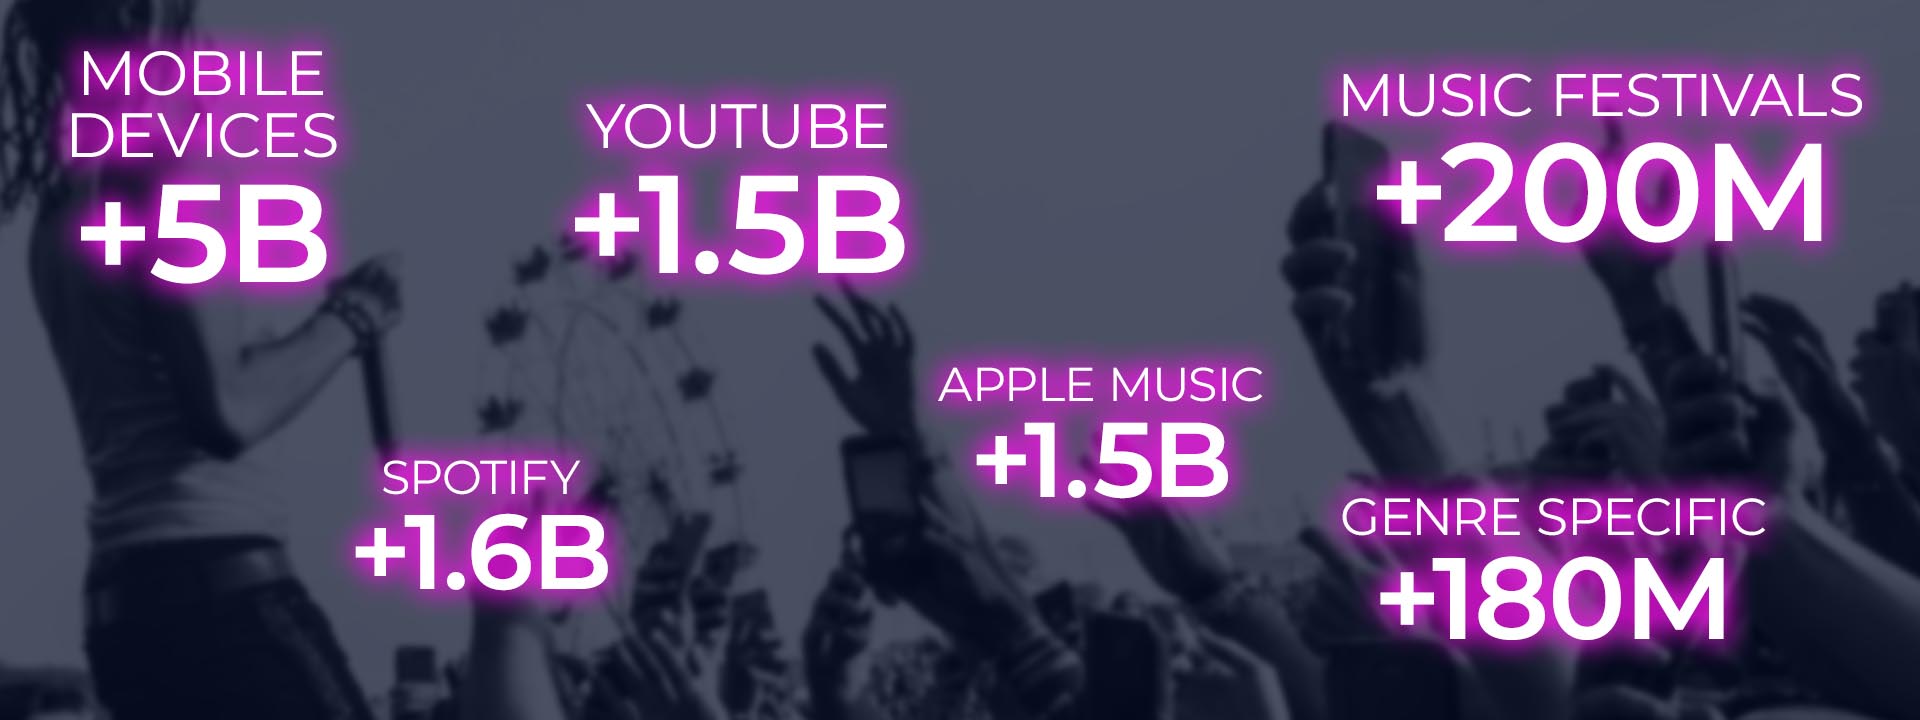
A recent survey from MRC Data offers a snapshot of the music industry in Canada, as well as globally, for the first six months of 2021 compared to 2020.
Stats in Canada
- Total album consumption is up 10.6%
- On-demand song streaming is up 11.4%
- Total digital music consumption is up 10.9%
- Physical album sales are up 5%
- Vinyl album sales are up 53%, but it still represents a very small part of the market

music//02
Define Audience by
Location + Web
& In-App Data
We can customize any audience anywhere at anytime that you may request. Below are a few audience personas:

Mega Venue Goers
- Seen going to big ticket events
(Scotiabank Arena, Bell Centre, Rogers Arena, Rogers Place, Budweiser Garden)
- Music genre: Pop, other
(A list artists, reboots of elder millennial & gen X)
- Frequent 4 + big ticket events /year
- Seen visiting music instrument & related retailers in-store & online
(Long McQuade, Cosmo Music, Marshall Music, RedOne, Music City Canada)
- Stream 75+ hours of music content /month
(Apple music, Spotify, YouTube, Online Radio)
The Local
- Seen going to mid/small ticket events
(The Bovine, Better Than Fred’s, Massey Hall, Broken City, Call The Office, The Drake Hotel)
- Music genre: range from indie folk/rock, dance/house, hip hop
- Frequent 10+ mid to small events per year
- Seen visiting music instrument & related retailers in-store & online.
- Stream 100+ hours of music per month
Festival Fans
- Seen going to pop up yearly summer events
(Osheaga, North by Northeast, Vancouver Island Music Fest, Bluesfest, Boots & Hearts)
- Music genre: All genres can be targeted by festival
- Frequent 2 + big ticket events per year
- Seen visiting music instrument & related retailers in-store & online.
(Long McQuade, Cosmo Music, Marshall Music, RedOne, Music City Canada)
- Stream 75+ hours of music content per month
(Apple music, Spotify, YouTube, Online Radio)
movies//01
Trend Predictions:
Movie
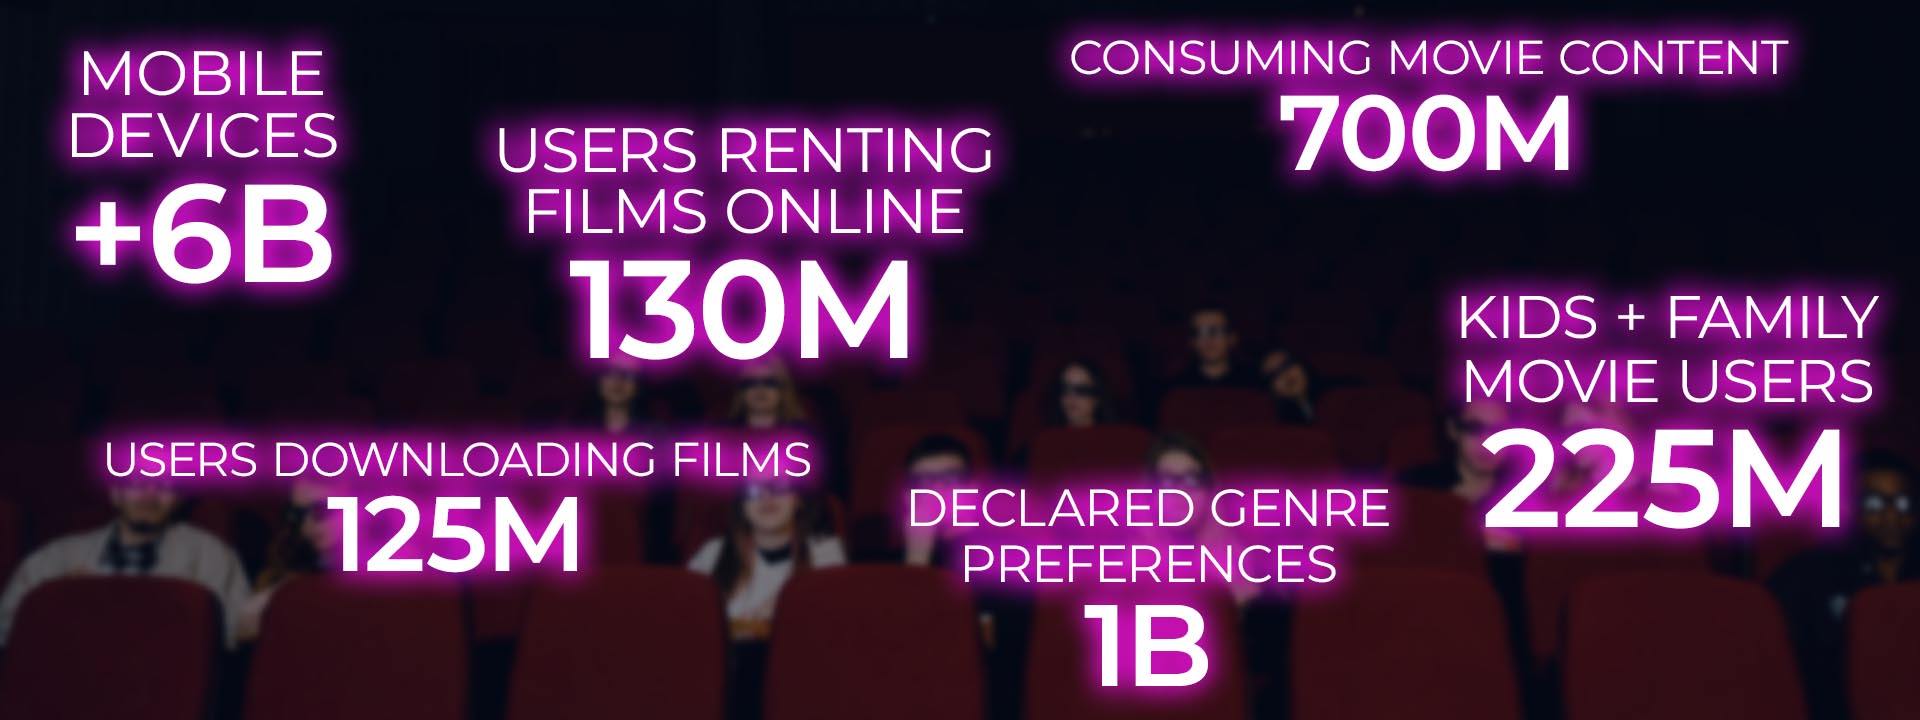
With more films being released to movie theaters, cinema advertising is projected to reach nearly $700 million in 2022, a year-over-year increase of 70%
Stats in Canada
- With movies back in theaters, cinema advertising will increase by 53%.
- After a miserable 2020, publishing will show a modest uptick of +2% at $16.6 billion, the growth will be driven by digital ad dollars (+18%) as traditional print ad dollars continue their freefall at (-12%).

movies//02
Define Audience by
Location + Web
& In-App Data
We can customize any audience anywhere at anytime that you may request. Below are a few audience personas:

Movie Goers
- Seen going to movie theatres
- Movie genres: All genres can be targeted by film
- Frequent 10 + movies per year
- Stream 18+ hours of movie content per month
(Apple music, Spotify, YouTube, Online Radio)
Theatre Buff
- Seen going to theatres across Canada
(Mirvish, Grand Theatre, Hot Docs, Globe Theatre, Citadel Theatre, The Broadway, Rainbow Stage Theatre genre: All genres can be targeted by show/event)
- Frequent 4 + big ticket events per year
- Seen online searching for plays, musicals, dramas, comedies coming this summer
(Mirvish, Toronto Theatre, TicketMaster, Broadwayworld, Todo (local cities))
- Stream 30+ hours of theatre, musical & audible video and/or audio content per month
(Apple music, Spotify, YouTube)
music&movies//01.a
Location Insights
Reporting
The Location Insights Report provides an overview of those people (anonymous) who visited a specific physical location.

You’ve learned more about your locations, your customers, and your competitors, now time to find out if your advertising is working and driving a measurable increase in your store traffic and sales and ecommerce.
music&movies//01.b
Foot Traffic Attribution
Reporting
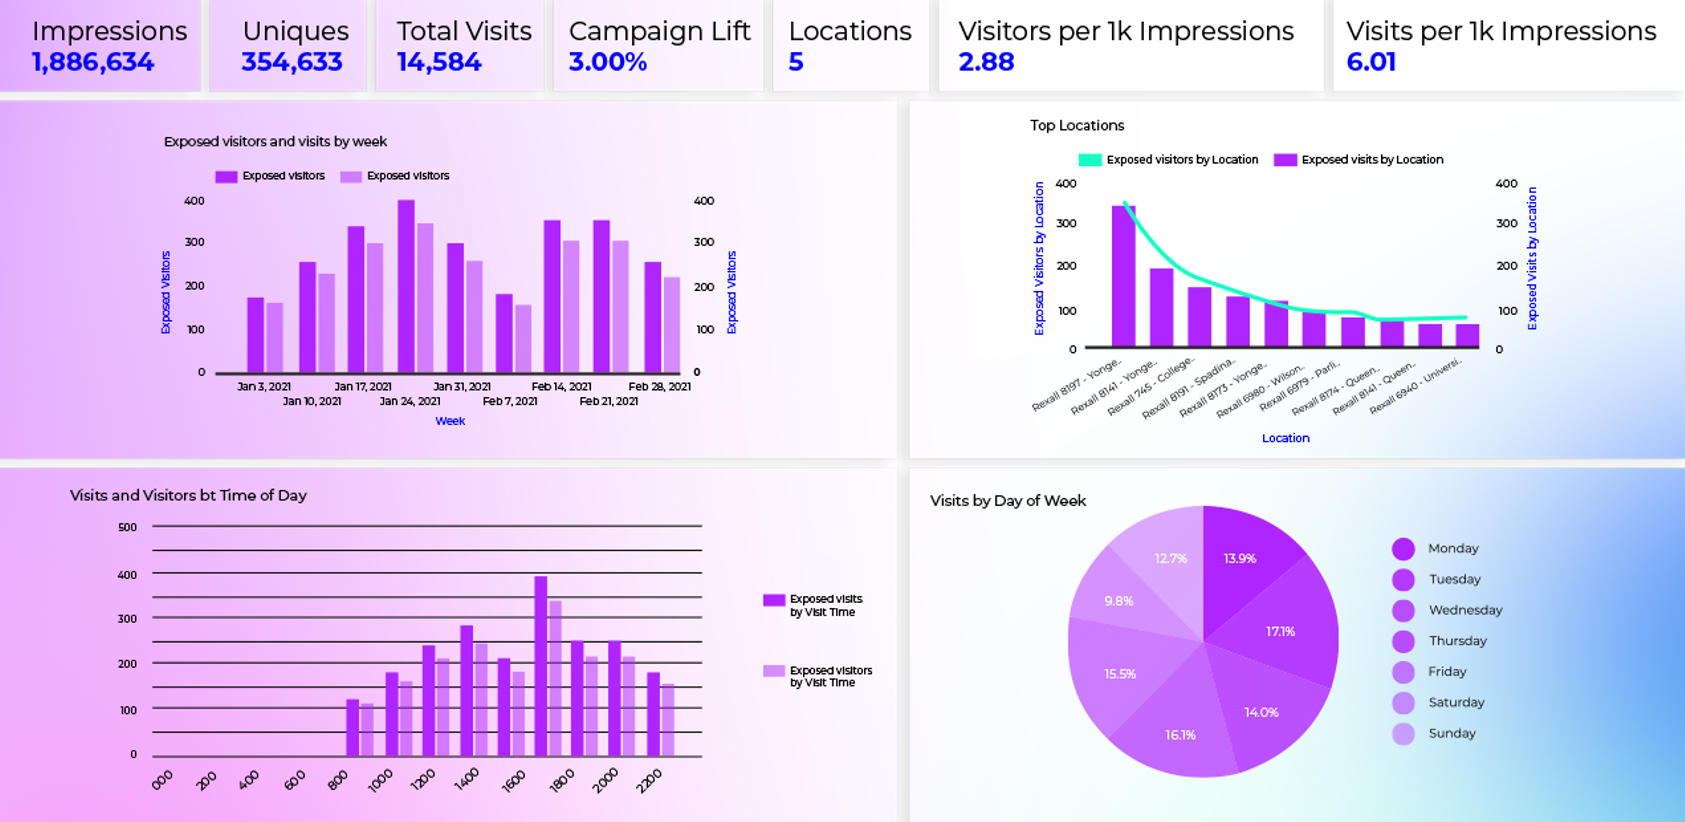
What is it? – The FTA Report outlines how many visitors saw an ad from the campaign via ANY digital media channel and later visited a location of interest (LOI).
Methodology – Powered by our Mobile Intelligence Engine (MIE), CDM processes billions of data points each day to create the massive, high-quality mobile location data store that, combined with our highly accurate boundary polygons, generate the most accurate location measurement solution on the market.

Depending on the campaign the report will include visits by the Day of Week, the Time of Day, Top Locations, per tactic, per week and if desired per OS.
Who we are
Chameleon Digital Media is a location-based data company that utilizes mobile footprints to understand consumer behavior.
Customized, real-life, movement data allows our customers to capture business insights and better target specific audiences.


