


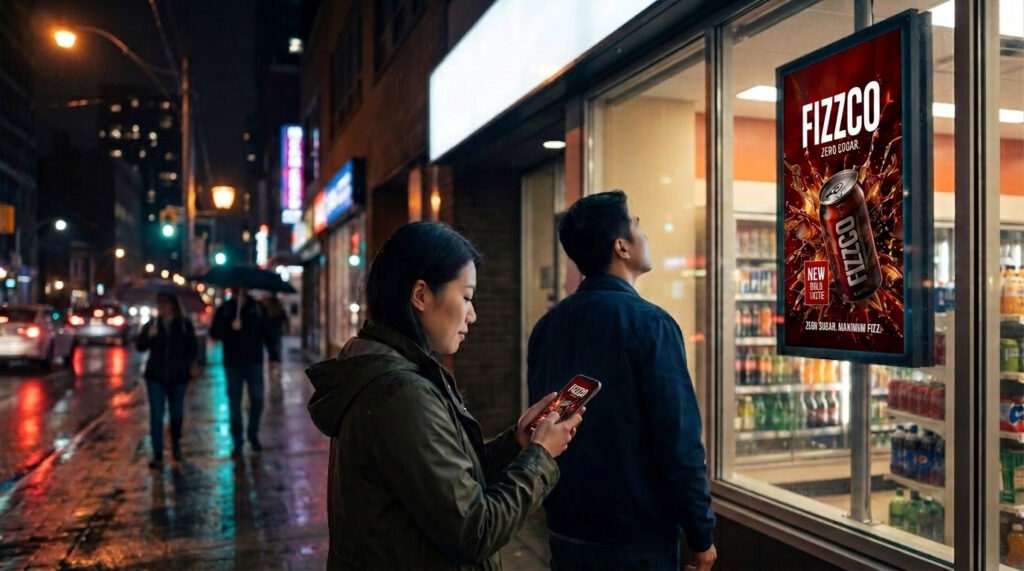
US out-of-home advertising hit a record $9.46B in 2025, and digital formats grew 10.5% to reach 36.3% of that spend.1 Yet DOOH still loses plan share to channels that can report conversions. On October 8, 2026, Alan Sifuentes and Cheryl Luciani of Chameleon Digital Media showed DPAA members how DOOH attribution closes that gap. Watch the full 21-minute session below, then read the key takeaways.
Watch: After the Impression, the full DPAA webinar
Presented as part of the DPAA Research and Technology Series.3 Alan Sifuentes is Chief Digital Officer and Cheryl Luciani is VP Sales at Chameleon Digital Media.
- 0:00 Why the first impression is only the start
- 2:25 Movement data: where your audience goes next
- 3:46 Closing the loop on out-of-home
- 5:35 Screen-level precision and the 12-month lookback
- 7:28 Hand-drawn polygons, not radius circles
- 9:11 Scale across devices and channels
- 11:24 Consent, aggregation, and privacy
- 13:18 Conquesting with real-world signals
- 14:06 DOOH as the anchor for every other format
- 16:20 Measuring the full picture
- 17:49 3 campaigns, 3 measured outcomes
- 20:01 How screen networks can work with us
DOOH attribution is how out-of-home wins budget back from digital
Out-of-home is growing. 70% of the top 100 OOH advertisers increased their spend in 2025.2 The constraint is proof. As Alan Sifuentes put it, out-of-home sellers are not only competing with other out-of-home companies. They are competing with every channel in the plan, and digital channels win share because they report conversions.
Out-of-home already does the hardest part. It creates the impression. The opportunity for screen network operators is to show buyers what happened after it: where exposed people went, what they bought, and whether the campaign drove visits.
From impression to visit: how the closed loop works
Chameleon Digital Media builds audiences from real-world movement, not inferred interests. For a screen network, that means 4 steps:
- Identify the people who were near a screen while a campaign ran
- Model that exposed audience to understand where else they go, shop, and dine
- Extend the message to the same audience across CTV, mobile, display, audio, and social
- Measure online and offline outcomes, including verified store visits
The measurement feeds back into planning. Your next proposal is built on what the last campaign proved, not on a demographic profile. Learn more about audience targeting from real-world visits.
Hand-drawn polygons, not radius circles
A radius circle counts everyone in range, including people who could never see the screen. Chameleon Digital Media draws each polygon by hand around a screen’s actual sightline, with polygon precision of about 3 feet around venues.4 That isolates the people with a real opportunity to see the ad while it played.
2 more filters keep the audience clean. A 12-month lookback lets you build an audience from a campaign that already ran. Dwell patterns separate customers from staff, so someone at a location 4 or 5 times a week for 6 hours or more is excluded from your insights.
This does not replace your impression counts. It identifies the highest-value slice of them: the people most likely to act on the ad, online or in store.
Measuring what happened after the impression
Chameleon Digital Media measures exposure with 1 pixel appended to your digital creative, which produces a unified report across formats. From there, you get:
- Verified store visits and conversion rate differences
- Incremental lift against control-group baselines
- Foot traffic attribution across every medium, including CTV
- Online conversions combined with in-store visits for a full view of outcomes
Because the data looks back 12 months, a baseline does not have to be planned weeks in advance. You can index against last year’s event or the previous 4 weeks after the fact.
DOOH attribution results from 3 campaigns
Chameleon Digital Media shared 3 results during the webinar.
- Convenience retail: mobile display and retargeting near each location drove a 54% store traffic lift, with 28% of visits coming from shoppers of nearby competitors.
- Apparel retail, Toronto: an out-of-home campaign for a Canadian intimates brand drove a 160% lift in total store visits, and visits to the flagship grew 4×.
- Lottery: in-store DOOH in convenience stores, combined with mobile retargeting of non-purchasers, returned 7.2× return on ad spend.
Privacy-safe location data for DOOH buyers
Every DOOH seller hears the same question from buyers: is this data safe to use? Chameleon Digital Media location data comes from opted-in mobile apps, with consent captured at collection. It is aggregated to cohorts, never down to an individual, and no personally identifiable information is used at any stage. See the Chameleon Digital Media compliance page for details.
How screen network operators can start
Chameleon Digital Media works behind the scenes, so you sell the insight and measurement as part of your package. 3 ways to start:
- Send us a location. Send a high-traffic screen in your network or a bricks-and-mortar location, and we will send back a free location analysis.
- Brief us. Send an RFP for an upcoming campaign, and we will provide a location analysis and recommended audience strategy.
- Consult with us. Have an active or past campaign where better insight could secure a renewal? Let’s talk.
To request your free location analysis, email the Chameleon Digital Media sales team at info@chameleondigitalmedia.com.
References
- OAAA via MediaPost. “OAAA Reports OOH Advertising Rose 3.6% In 2025.” https://www.mediapost.com/publications/article/413543/oaaa-reports-ooh-advertising-rose-36-in-2025.html.
- OAAA via invidis. “OOH: Apple tops ad rankings as DOOH keeps growing.” https://invidis.com/news/2026/04/ooh-apple-tops-ad-rankings-as-dooh-keeps-growing/
- DPAA. “Research and Technology Series.” https://dpaaglobal.com/research-and-technology/
- Chameleon Digital Media location data. “Polygon precision around venues.” https://chameleondigitalmedia.com/digital-media-analytics/